POS sales
- 2,175.36
- 1,542.18
- 1,089.24
True Margin reads current-week operating signals, forecasts pre-close loss, explains the cause, and tells each team what to do next.
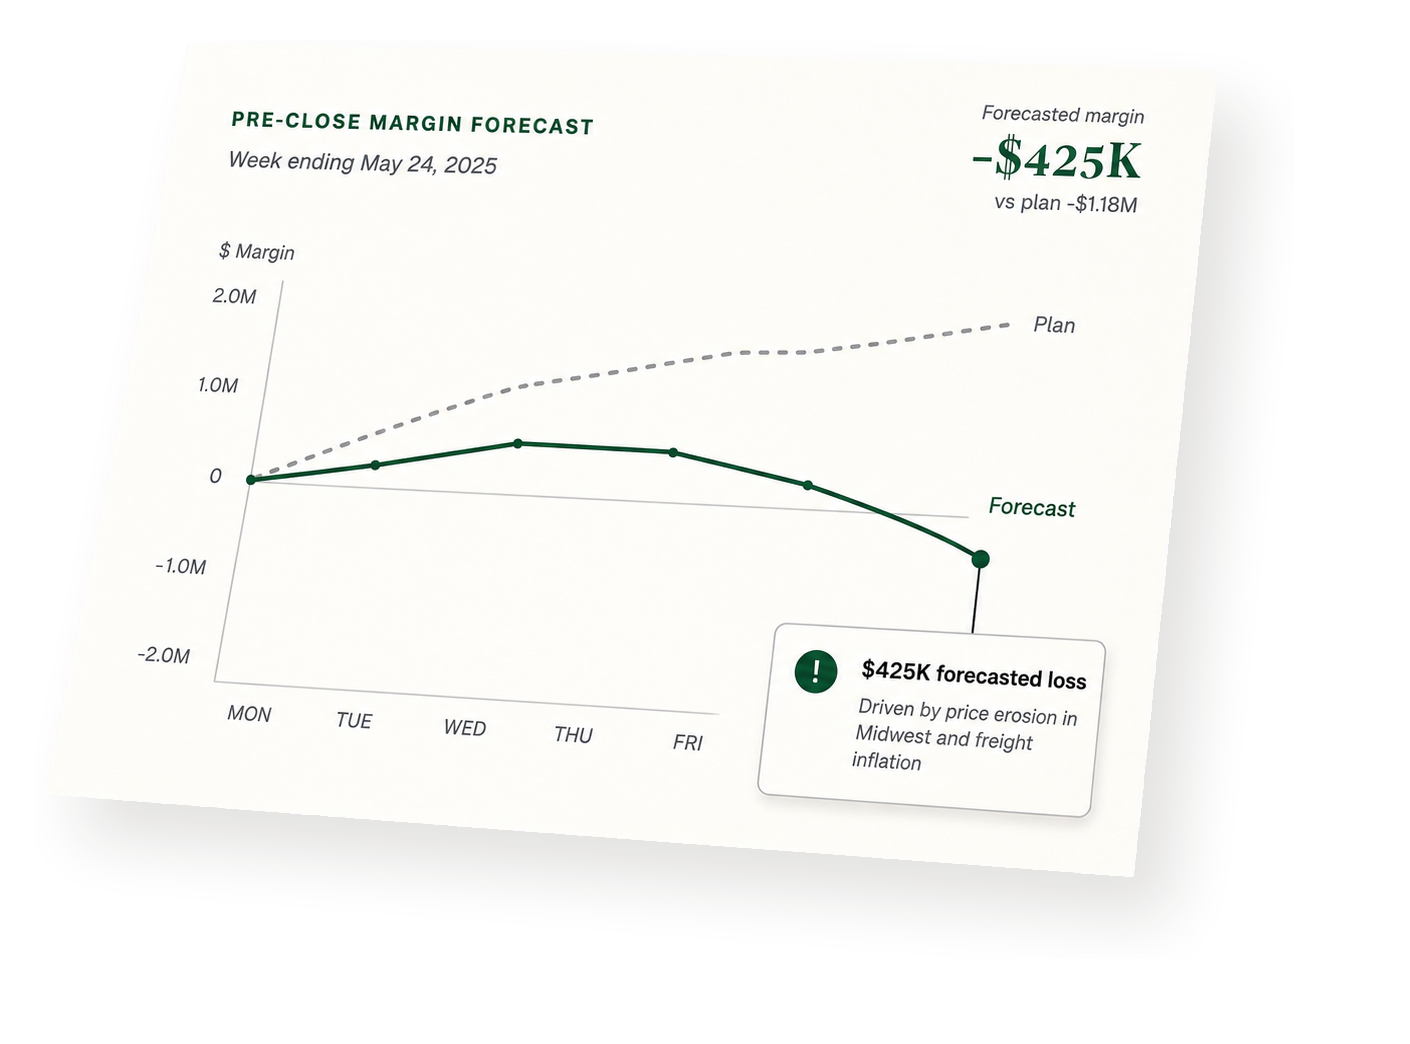
POS, invoices, inventory, bank feeds, labor, recipes, and manager context move all week. Bookkeeping usually reconciles them too late.
Month-end report
Month ended May 31
A continuous cycle that predicts risk, closes gaps, and guides the right actions before they impact your numbers.
Ingests operational, commercial, and market signals across your systems.
Quantifies likely impact by driver, customer, product, and period.
Finds confidence gaps and asks the right owners for the missing detail.
Prioritizes high-impact actions aligned to policy, capacity, and strategy.
The loop learns from every approval
True Margin quantifies the full financial impact, backed by your data, so you can act with confidence.
Identified May 12, 2025 • Impacted SKUs: 14 • Last 13 weeks
Rising tuna costs from the supplier combined with portion drift are eroding contribution margin on affected menu items.
Supplier price increased 18.7%, average portion size is up 9.6%, and impacted items represent 21% of tuna sales dollars.
-$0.38 price impact + -$0.29 portion drift = -$0.67 per unit x 280,000 units = +$187,400 annualized impact.
Renegotiate tuna pricing with supplier and tighten portioning to standard. Target completion in 30 days.
True Margin connects every financial function so your numbers stay accurate, decisions stay clear, and the business keeps moving.
Sets the variance policy and decides what needs attention before close.
Turns the forecast into site-level decisions while the week is still live.
Prepares the support packet so the close starts with fewer open questions.
Separates vendor cost movement from usage and portion drift.
Connects counts, transfers, and theoretical usage to margin movement.
Shows when schedule choices are creating or protecting contribution margin.
Keeps every recommendation tied to evidence, approval, and outcome.
True Margin delivers pre-close margin forecasts purpose-built for how your business runs.
01
NowMulti-location complexity. Real-time shifts. Tight margins.
02
PlannedDepartments. Seasonality. Labor intensity.
03
PlannedPayer mix. Staffing. Supply costs.
04
PlannedHigh SKU velocity. Thin per-item margins.
05
PlannedWIP complexity. Material volatility.
Sign in to your existing workspace or create a new account to start running weekly operating reviews in True Margin.
Owner memo
This memo summarizes the current forecast for the period, highlighting key drivers, risks, and the latest outlook versus plan.
| Metric | Forecast | Plan | Variance |
|---|---|---|---|
| Revenue | $24.8M | $25.1M | (1.2%) |
| Gross margin | 36.5% | 35.7% | +0.8pp |
| Operating expenses | $8.7M | $9.1M | (4.4%) |
| Operating income | $0.9M | $0.6M | +0.3M |